Pulling this page together.
Preparing content, navigation, and supporting references for this route.
Preparing content, navigation, and supporting references for this route.
A model for weighting region-graph edges by gateway importance, throughput, and closure sensitivity so the graph becomes predictive instead of merely descriptive.
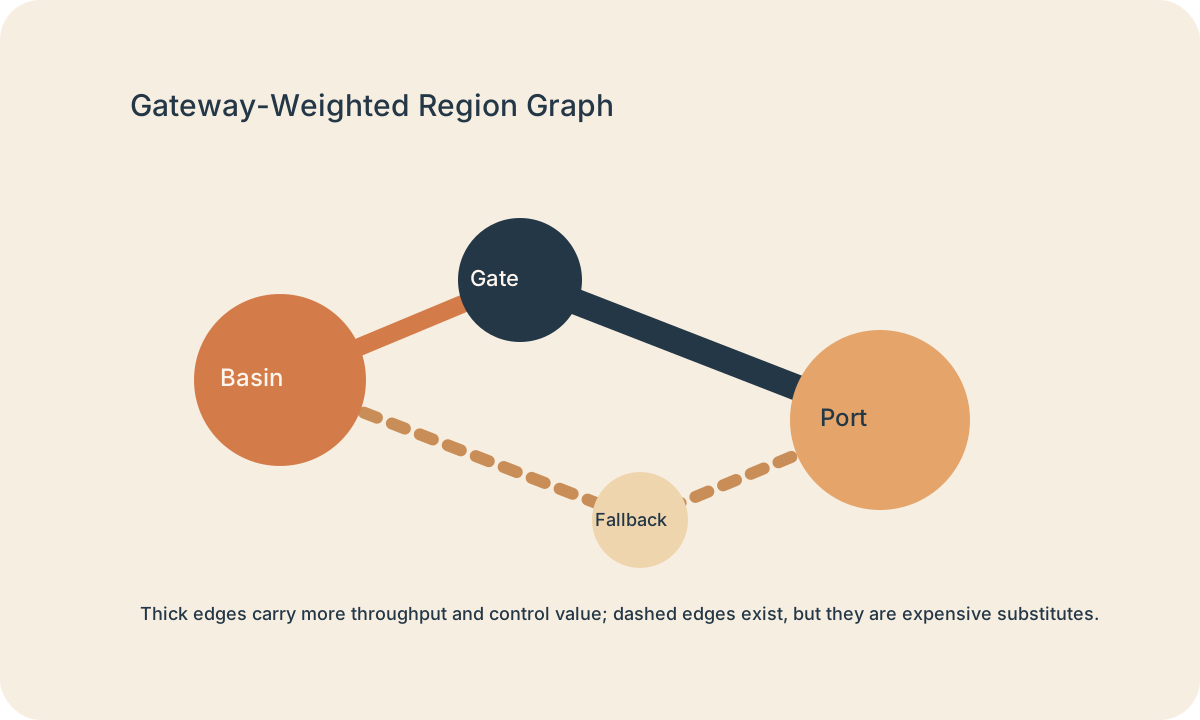
A plain graph is useful, but a weighted graph is predictive. Gateway weighting turns edges into ranked operational claims: some links carry more throughput, more risk, more coercive value, or more rerouting cost than others.
That matters because a region graph without weighting can only say that nodes are connected. It cannot yet explain which closure would matter most, which corridor is worth guarding first, or which gateway quietly determines the behavior of the wider map.
Start with the meaningful basins, corridors, and gateways rather than with every local road segment.
Rank each connection by throughput, control value, rerouting cost, and reliability across time.
Check whether fallback routes are genuinely comparable or only decorative alternatives on paper.
| Axis | Question | Signal |
|---|---|---|
| Throughput | How much movement can the edge carry under normal conditions? | Port capacity, road width, convoy volume, crossing frequency |
| Control | How easily can an actor dominate the edge? | Single bridge, customs gate, pass mouth, harbor chain |
| Substitution cost | What happens if the edge fails? | Long detour, seasonal reroute, multi-hop fallback, collapse |
| Temporal stability | How reliable is the edge over time? | Weather windows, flood risk, political volatility, maintenance burden |
Once edges are weighted, the graph stops being a neutral summary and starts becoming a planning tool. You can identify which gateway deserves fortification, which corridor defines price stability, and which fallback edge is too weak to count as real resilience.
This is especially useful in large maps where many routes exist but only a few carry decisive flow. Weighting lets the abstraction preserve asymmetry instead of flattening every edge into equivalent possibility.
Provides the unweighted abstraction that this model turns into a stronger operational tool.
Chokepoint RegimeExplains the wider condition that appears when a few heavily weighted edges dominate the graph.
Topological Redundancy MatrixTests whether the graph's edge weights reflect true substitute quality and closure behavior.
The reusable lesson is that graphs become strategically useful only after their edges are ranked by what they actually carry and what failure actually costs. Use this model for corridor maps, supply networks, trade systems, and regional abstractions that need to move from description toward prediction.